RESULTS AND DISCUSSION
Plant health and the long-term post-harvest storage of sugar beet roots
Agronomic inputs and storability
Quality
The assessment of the impact of agronomic inputs on the storability of sugar beet roots (Paper I) showed that the available water during the growing seasons had a large effect on the changes to quality of roots during post-harvest storage. The accumulation of invert sugars and the loss of sucrose during post-harvest storage approximately doubled for the optimum water availability treatment (Paper I, Figure 2 E-F). The availability of N during the growing season had no effect on the rate of change in quality of roots during post-harvest storage. This study had the underlying assumption that differences in changes to quality during post-storage between the agronomic treatment levels would be a result of differences in mechanical properties and thus mechanical damage.
Mechanical properties
Paper I showed that the level of nitrogen available during the growing season only has a minor negative impact on the mechanical properties of sugar beet roots (Paper I, Figures 1 A-B). The available water during the growing season had a statistically significant (α = 0.05) but minor effect. The plants with optimal soil water availability over the duration of the growing season had higher puncture resistance and tissue firmness in comparison to the plants that were wet during the last month prior to harvest and the no supplementary water control (Paper I, Figures 2 A-C). The differences in mechanical properties were mainly between varieties and environment, where environment is a combination of site and year (Paper I, Table 2). This is a common finding in the examination of mechanical properties in sugar beet (Kleuker & Hoffmann, 2020, 2021, 2022). As nitrogen and water are two of the major agronomic inputs to the sugar beet crop, Paper I suggests that if a management goal is to ensure high values for mechanical properties, then agronomic inputs in a given growing season are likely of little consequence. Choice of variety is much more important. The variation in mechanical properties attributed to environment in Paper I is important to note, primarily because it is not a very descriptive category as it includes all the variation that occurs between sites. This includes historical management and soil properties. This suggests that exploration into the mechanisms behind variations in mechanical properties beyond variety has potential. Similar results for the relationship between growing season available water and the mechanical properties puncture resistance and tissue firmness were found in the falling-ball experiment (SS2). Here the roots from plants that were irrigated during the last month did have a puncture resistance lower than that from the roots with additional water excluded during the last month (roof), but were not different from the control treatment (Figure 9 and Table 2). No differences in tissue firmness were seen. The apparent modulus of elasticity for the irrigated roots was different from the other two agronomic treatments, resulting from the combination of lower puncture resistance and a greater distance to puncture. This suggests that well irrigated roots may suffer from less damage from a given impact (Ruiz-Altisent, 1991), but also be more difficult to slice at processing (Vukov, 1977).
Table 2. Mean mechanical property values from falling-ball test in SS2. Number of observations per treatment = 40. Letters indicate significant groupings from post-hoc Tukey test.


Mechanical damage
Paper I showed that neither the level of nitrogen nor water available during the growing season effected the rate of mechanical damage to the roots prior to post-harvest storage, measured as root tip breakage (Paper I, Figures 1D and 2D). Given the small differences in mechanical properties, this fits within the expectations of the study. The falling-ball test (SS2), measuring damage as cracking and contact point surface damage, concurred the results for the late season water availability treatment in comparison to the control treatment of no supplementary water (Table 3).
Table 3. Mean rates of damage from falling-ball test in SS2. Number of observations per treatment = 40. Letters indicate significant groupings from post-hoc Tukey test.

Other health dimensions and agronomic inputs
The focus of Paper I was on mechanical properties and a single level of mechanical damage. These two dimensions of plant health were not able to explain the observed differences in storability under constant post-harvest storage conditions. It stands to reason then that the link to loss of quality for the agronomic input of available water during the growing season is through a different dimension of plant health. In Paper I, the possible explanation of an increased disease load was given. The suggestion was that the creation of the optimum soil water conditions for plant growth also created optimum conditions for the growth of the soil borne pathogen Aphanomyces cochliodes: a high incidence of secondary aphanomyces infection was observed in the field trial (Figure 10). This was not quantified, but the disease was so widespread in the field in 2018 that the section of the plots sown for yield and dirt-tare analysis had to be harvested with the section that was sown for mechanical property and post-harvest storability analysis, so as to ensure enough roots of a normal form could be sources. There was evidence of the disease in 2019, but not to the same extent. This plant disease hypothesis is supported by the findings of Campbell and Klotz (2006). It also aligns with the recommendation in Sweden to only store roots from healthy plants.

The accumulation of invert sugars in the roots from the optimum water availability treatment also suggests the disease dimension of plant health is a likely mechanism (Campbell et al., 2011; Kenter et al., 2006). It was not reported in Paper I, but there was a large increase in mould formation within this treatment during post-harvest storage. In the first year of the trial, approximately 25 % of roots from the optimum water availability treatment scored 2 or 3 on a 0 to 3 scale of mould infestation, while it was less than 5% for the control and wet during the last month prior to harvest treatments (see Kleuker and Hoffmann (2020) Figure 7B, NBR). It is not clear whether this increase was a result of an increased pre-harvest disease level, or greater harvest damage on a dimension that was not quantified. Two other interesting findings from the work within this COBRI project support the conclusion in Huijbregts et al. (2013) that more work is needed around the pre-harvest factors driving root health and quality loss during post-harvest storage. The roots from the Netherlands repeatedly returned rates of loss of sucrose during post-harvest storage beyond those that could be expected from their appearance. The roots were generally very clean and entire, but rates of loss were the highest of all countries. This has again been observed in the collaboration’s work on virus yellows.
The second observation was from exploratory work using roots taken from a field in Sweden with a liming trial. Roots from sections of the field where the equivalent of 8 t/ha CaO was applied six years previous were compared to roots from sections that had no lime at that time. The mechanical properties showed no difference at all, but the rates of sucrose loss during post-harvest storage were slightly more than double for the roots from the control section of the field. This work is unpublished. Given calcium is an important element in the formation of cell walls (Marschner, 2012), it was expected that the mechanical properties would test higher for the roots from the limed sections of the field. That this was not observed means a different dimension of plant health has to be considered. A possible explanation is again in the soil microbiology. Lime, especially at such a high rate, is expected to have a sanitising effect on the soil, reducing the prevalence of pathogens such as Aphanomyces cochliodes (Huijbregts et al., 2013) or some other unspecified disorder (Wills et al., 2007b). Alternatively, it may have changed the distribution of the soil microbiology, permitting more of the beneficial microbes like those reported by Molin (2022) to flourish. The possibility that the effect of lime on the soil structure lead to lesser rates of surface damage should also be considered.
The inclusion of the treatment of the available water during the growing season in the COBRI project that gave Paper I was a result of discussions with growers where they had observed high rates of quality loss during post-harvest storage from sugar beets that were irrigated and grown in sandy soils. This work has shown that the available water dimension cannot be excluded in the examination of sugar beet root storability, but it has also shown that the soil, and the interaction between available water and the soil, needs greater attention.
Assessment of mechanical properties
The assessment of a method for use of a handheld penetrometer in the sugar beet crop (Paper II) showed that the handheld penetrometer was able to provide a reliable assessment of the tissue strength of sugar beet roots. It was very successful in ranking varieties, finding the same patterns for firmness as those found by the laboratory penetrometer for puncture resistance and tissue firmness (Paper II, Figures 2). The ranking of varieties with the handheld penetrometer was also shown to be stable across years in the Swedish national variety trials (Paper II, Figure 6). The handheld penetrometer has a much lower capital cost than the laboratory equipment. Sampling is quicker, with a sampling rate of double the laboratory equipment. It can be applied when the roots are still growing in the field, avoiding the need for extra research plots and the transport of material. It can also be applied well before harvest, permitting earlier reporting of results. A well-documented issue with handheld penetrometers is the inter-operator variability (DeJong et al., 2000; Harker et al., 1996). While this did not appear as an issue in Paper II (Paper II, Figure 5), the paper would have benefited from a greater formal investigation of these differences between operators. Clear operating procedures and training of the operators was noted as a critical component of the application of the handheld penetrometer.
Defining the analogous laboratory metric to the handheld penetrometer in Paper II was quite interesting. The handheld penetrometer records only the maximum force during each sample. Using the instrument with a sampling depth of 5 mm, it appears that this maximum is when the probe punctures the periderm. This suggests that puncture resistance will be the metric from the laboratory penetrometer that is most similar. On analysis of the results, however, it appeared the values more closely mirrored the tissue firmness measurement of the laboratory penetrometer (Paper II, Figure 3 & 4). There was also a conflict with the nomenclature. Abbott (1999) notes that the values obtained from a handheld penetrometer are commonly referred to as firmness and have been for most of the approximately 100 years of the use of the device. However, in Paper II it was felt that this would conflict with the term tissue firmness from Kleuker and Hoffmann (2019) and thus the term handheld pressure was adopted. In Paper III, free from this direct conflict, the term firmness is used.
The major limitation of the handheld penetrometer is that it only records a single metric. This is of particular importance to note when an application is outside the scope of known applications. The difference in results between Paper III and SS2 is an example of this. In Paper III, the handheld penetrometer was not able to find differences in firmness in any dimension. This was an a-priori expectation, but this expectation changed during the experiment owing to the tactile observations of a rubbery feel to the roots with high weight loss from ventilation. It was this observation that lead to the supplementary study SS2. Differences in mechanical properties using the laboratory penetrometer were subsequently found in SS2.
The apparent modulus of elasticity
The rubbery feeling observed from roots with high weight loss in Paper III was investigated in SS2. The results showed that the puncture resistance of the roots that had been exposed to the ventilated treatment – a treatment similar to the highest airflow treatment of Paper III – was not different to the untreated roots or roots grown under a roof for 56 days prior to harvest (Table 2 and Figure 9). At the same time, tissue firmness, the apparent modulus of elasticity, and the rates of damage where all much lower. A single short crack was observed from the 40 roots from the ventilated treatment, while there was on average more than one crack per root for the other three treatments. It is not possible to say that the difference in damage is more closely related to the tissue firmness or the apparent modulus of elasticity. Indeed, it is reasonable to expect that these two metrics are highly correlated given they relate to the ability of the cells structure within the root to move (Ruiz-Altisent, 1991). The results do suggest that it should be explored if the apparent modulus of elasticity should be included in an expansion of the standard methodology from Kleuker and Hoffmann (2019). This is particularly so given the required data is already available from the laboratory equipment, and that elasticity has been identified as an important mechanical property in relation to slicing of roots at the factory (Vukov, 1977).
Dynamic impacts
The first fall test with the falling-beet (SS1) was not able to find differences in impact force or pressure between the three varieties used in Papers I and II (Table 4). It is likely that neither the sample size nor the resolution of the measurements was sufficient. The high speed camera progressed in increments of 1.04 milliseconds, and the average impact time was approximately 3.5 milliseconds – a similar value to that found for dynamic impacts on sugar beet roots in Kołodziej et al. (2023). When the method was applied to roots of different sizes, significant differences were found for all metrics (Table 4). From a drop height of one meter, large roots had an average impact pressure of 1.3 MPa compared to 2.2 MPa for the small roots. This somewhat counter-intuitive result stems from the larger momentum at impact being spread over a longer time and a larger area of impact.
Table 4. Mean results of drop test in SS1. Sugar beet roots dropped from a height of one meter, with impact at widest point of root. No differences between varieties were significant at α = 0.05. All differences between root size were significant at α = 0.05.
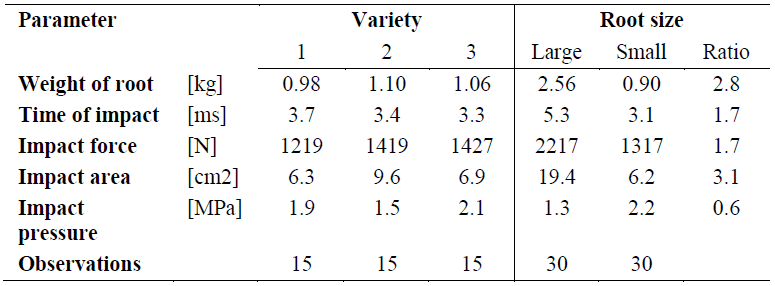
The falling-beet test (SS1) was developed in response to discussion about how the size of a sugar beet root would affect rates of damage and thus storability. It was clear that a greater mass would result in greater kinetic energy for a given fall height, but not how this greater energy would affect rates of damage. The results from this supplementary study suggest that larger roots are likely to have less damage. This result must be qualified with reference to the method, in which the roots were dropped on their sides with the impact at the widest diameter of the root.
Root size
Other insights have been gained from this research project on the role of root size and the damage caused by dynamic impacts beyond those associated with the assessment of mechanical properties. As part of the data collection for the modelling of the specific surface area (Asf) of sugar beet roots for the CFD modelling of clamp airflow and temperature (Paper IV), surface damage was also assessed. The results suggest that damage to the surface per unit of surface area increase with root size (Table 5). These results do not include tip breakage and top scalping area. Further, it must be remembered that assessing surface damage is notoriously difficult.
Table 5. Relationship between root size and surface damage. Source: field work from Paper IV. SA = Surface area.

Fall-test usability
The method used in the falling-beet experiment (SS1) was developed as it gave a controlled simulation of the impact identified as the largest in the commercial setting: a fall (Steven Aldis, (BBRO, England) 2018-07-11, personal communications). The second fall test, the falling-ball test (SS2), was developed in response to the difficulty in the method of the falling-beet test to control the impact site. The root often rotated and missed the desired point of impact: a problem also experience by Wilczek et al. (2020) in their project that similarly involved the controlled dropping of sugar beet roots. It was also not possible from the falling-beet test to assess the rate of damage from a fixed impact given the force at impact varied with the root weight.
Force and pressure assessment was only conducted with the falling-beet test, but could be applied to the falling-ball method. There was a relatively large data analysis component in assessing force and pressure from a dynamic impact. This could be improved with more automated systems for image analysis, but that would likely also be costly. The use of digital pressure mapping tools (Tekscan T-Scan system) was explored in the falling-beet experiment, but the temporal resolution was not sufficient to ensure the full force profile would be captured.
Sampling with the falling-ball method without the measurement of dynamic forces was able to proceed at the same speed as the sampling with the laboratory penetrometer. There is no reason to suspect the falling-beet test without force assessment would be slower. Both methods require the diversion of material in the same manner required for assessment with the laboratory penetrometer and thus it is simple to pair the assessments.
The two fall-test methods have their use cases. The falling-beet method simulates the actual commercial situation with a fixed fall height and the energy at impact being in relation to the size of the root. The falling-ball method permits the application of a constant dynamic force, simulating a root sitting in the pile or being struck by a piece of machinery. Both methods have the ability to link static mechanical properties, dynamic response to impact, and rates of damage from dynamic impacts at the level of the individual root.
Storage environment and the long-term post-harvest storage of sugar beet roots
Moisture and mass transfer
Quality and moisture
The modified environment experiment (Paper III) found that it was possible to use ventilation to manipulate sugar beet root quality. It showed that a short, intense period of forced ventilation could result in large increases in the sucrose concentration in roots while not having a negative impact on the quality traits of the concentration of amino nitrogen, potassium, or sodium, or on the dirt-tare or puncture resistance of the roots (Paper III, Figure 6 and Table 3). An increase in sucrose concentration of 16.6 % (3.0 pp) was observed under the most extreme conditions (Run 2, Air 7, Days 7). A decrease in sample weight concomitant with the increase in sucrose concentration was observed (Paper III, Figure 6). The weight loss observed under the most extreme conditions was 13.5 %. This weight loss and the corresponding increase in sucrose concentration was attributed to the dehydration of the roots: no decreases in total sucrose were observed (Paper III, Table 3).
Paper III had a clear focus on a short and intense period of forced ventilation. The application of the results beyond the scope of the research is not recommended. If a system was implemented to deliberately increase quality through dehydration, it would ideally occur directly before delivery and processing. This could be at the end of a period of long-term post-harvest storage. Higher loss of quality is expected from dehydrated sugar beet roots during long-term post-harvest storage (Lafta & Fugate, 2009). Forced ventilation could also decrease clamp temperature and thus rates of wound healing at the start of a period of long-term post-harvest storage (Fugate et al., 2016). It was not possible to assess invert sugar levels in this study owing to a technical failure in the laboratory and as such the question of the impact of intense ventilation will have on this quality trait remains. It can, however, be expected that no significant changes will occur given both the findings of Lafta et al. (2020) and that the lack of change in total sucrose suggests respiration is not adversely impacted. The potential impact of dehydration on processing should also be considered. The previously mentioned rubbery feel to roots from the higher airflow treatments in the modified atmosphere experiment (Paper III) and the increased elastic behaviour of the roots in the falling-ball supplementary study (SS2) suggests the dehydrated roots will be more difficult to slice at processing (Vukov, 1977).
The commonly quoted airflow rate in ventilated piles of 20 cfm per ton (Backer et al., 1979; Downie, 1950) is equivalent to approximately 0.037 m3/h/t, or about one-tenth the Air 1 rate of Paper III. No field data is available on the rate of airflow in clamps under natural ventilation. The solutions from the CFD modelling of airflow (Paper IV) for the uncovered clamp suggests that the air speed was about 0.44 m/s under the first layer of roots, and 0.40 m/s in the middle of the clamp when the wind speed was the average of the long-term post-harvest storage period in Sweden of 4.5 m/s. In the relative airflow level treatments of Paper III, this is would be treatment level Air 12. This suggests that the average airflow in a clamp may be sufficient to drive considerable dehydration of roots during storage. This is yet to be verified. It is also subject to the practicalities of commercial operation in the field in which the airflow is variable, rainfall occurs, and where covers are used.
Mass flux
The relative rates of mass flux in the controlled environment experiment broadly followed expectations. Mass flux will be greater with a greater water vapour pressure deficit and thus, given Tetens equation and the assumption of thermal equilibrium in the system, at higher temperatures (Monteith & Unsworth, 2008). It would therefore be expected that in Paper III Run 1 and 4 would have the lowest mass fluxes, followed by Run 2, 3 and 5 (Paper III, Table 1). With some error, this is the pattern observed (Paper III, Table 4). It is also possible to compare runs with the same mean temperature and different mean relative humidity (Run 3 and 4), or runs with the same mean relative humidity and different mean temperature (Run 2 and 4), and see that the relationships between mass flux and temperature and humidity codified through Tetens equation (Paper III, Equation 3. Monteith and Unsworth (2008)) hold. The relationship between mass flux and air speed is codified in the Reynolds (Re) component of the Sherwood-Reynolds-Schmidt correlation (Equation 8 or Paper III, Equations 5 and 6). The four airflow rates of the modified atmosphere experiment had relative levels of 0, 1, 4, and 7. In the Sherwood-Reynolds-Schmidt correlation, the square root of Reynolds number is taken: Re0.5. This suggests that the ratio of convective mass transfer coefficients, kc, and thus mass flux in the experiment will be 0.0 : 1.0 : 2.0 : 2.6. These ratios are similar to the weight loss and mass flux observed (Paper III, Figure 5 and Table 4).
The modified atmosphere experiment was developed early in this research project with the intent to focus on the quality aspects of ventilated post-harvest storage. Its value as a work in the field of fluid dynamics and mass transfer was not realised until after the completion of the experiment. Had the initial focus been mass flux, defining diffusivity of water, and verifying the Sherwood-Reynolds-Schmidt correlation, it is likely a different experimental design would have been adopted. Most studies on mass flux in post-harvest storage systems are in highly controlled environments and measure single fruit (eg Caleb et al., 2013; Mahajan et al., 2008; Xanthopoulos et al., 2014; Xanthopoulos et al., 2017). This study would have benefited from greater control of the experimental environment, but the measurement of weight loss in a bulk hopefully gives a set of results that are practicable in the modelling of the commercial post-harvest storage system.
Modelling mass transfer
The results of the modified atmosphere experiment (Paper III) can be used in the modelling of mass transfer in a similar way that temperature and heat transfer has been modelled using Computational Fluid Dynamics (Paper IV). The convective mass transfer coefficient, kc, is required to model the transfer of water from sugar beet roots to air. The Sherwood-Reynolds-Schmidt correlation can be used to compute estimates of kc in the presence of a variable airflow, using an estimate of the diffusivity of water of the system and known properties of air (Carta, 2021b). Paper III found an average diffusivity of water of 2.43 E-05 m2/s for commercially harvested sugar beet roots ventilated in bulk, under experimental conditions. It also showed that the Sherwood-Reynolds-Schmidt correlation was sufficiently accurate in providing estimates for kc under the relatively high airflow conditions of the experiment (Paper III, Table 4).
Accurate modelling of mass transfer would be beneficial in the assessment of long-term field storage as it could help the understanding of changes to quality through changed sucrose concentration. It could also make estimates of temperature more accurate. The role of the heat of evaporation in heat transfer in bulks of sugar beet roots has been suggested as significant (Cannon, 1950; Zavrazhnov et al., 2021). Accurate modelling of mass transfer is also needed to understand the economics of long-term post-harvest field storage. The assessment of the gross income per harvested tonne in the modified environment experiment showed that a short duration, high airflow forced ventilation would lead to higher payments of up to 9.7 % (Paper III, Figure 8). This was primarily a result of the increased sucrose concentration being more highly valued than the loss in the mass of processable material. The design of the price model in Sweden is to pay for total sucrose and incentive quality. The results of the economic analysis reflect this. This assessment was only possible as the weight loss was known. Comprehensive data on rates of weight loss in sugar beet roots during long-term post-harvest field storage is difficult to find. Modelling mass transfer with the results of the modified atmosphere experiment (Paper III) can help fill this gap.
Any modelling of the transfer of water in a sugar beet post-harvest store would need complementary field research. Field research could focus on the transfer of water as weight loss from the roots as a bulk. Aggregate data would support the economic analysis. Preferably, field research would assess weight loss from the roots across the profile of the store. It would ideally include methods that capture the movement of moisture from, and back to, the soil attached to the roots. Paper III suggests that the transfer of water from this attached soil was relatively much quicker than from the roots, especially under high airflow conditions (Paper III, Table 3). It is also known that the water in this soil has large impacts on quality as dirt-tare (Mårtensson, 2017). The open environment in which clamps exist exposes them to rainfall, which would lead to re-hydration of surface attached soil. The permeability to air of the cover most commonly used on clamps – non-woven polypropylene fleece – was tested in Paper IV. Similar laboratory testing would be needed for permeability to water, including how this changes with duration of rainfall. Another challenge in modelling the transfer of water is in capturing the observed phenomena of condensation at the edges of clamps when covered with plastic. In addition to weight loss, surface moisture, and condensation, monitoring of the airflow would be highly recommended. The estimates of kc from the Sherwood-Reynolds-Schmidt correlation depends on air speed, and as seen in the CFD modelling of temperature (Paper IV), validation of the air velocity field in sugar beet bulks is required.
Temperature and heat transfer
The modelling of temperature in a sugar beet clamp (Paper IV) was deemed as successful. The model successfully captures the general trends of heat transfer, in that the solution for temperature follows the general trends of the experimental data. This model is the first that gives insight to the variation within a bulk of sugar beet roots while giving consideration to the fluid dynamics inside of the bulk. The rate of variation of temperature in the experimental data showed strong correlation with air speed and the model was able to capture this, with more rapid change in temperature with increased inlet air speed normal to the clamp (Paper IV, Figures C1-C6). The work of Tabil, Kienholz, et al. (2003) was extremely important in this endeavour: this was the only source of experimental data on the fluid dynamics of sugar beet bulk known to exist. The results of the model suggest that taking temperature from a single measurement point is not sufficient to capture the true distribution. For Figure 11a (Paper IV, Figure 6a), the experimental temperature sensors at 0.5 and 2.0 m from the top of the clamp on its central axis, read the same temperature. Variation through the clamp is still evident. For Figure 11b (Paper IV, Figure 6b), the difference between the same sensors is at its greatest point in the first 100 000 seconds of the simulation. Even then, there is variation within the clamp beyond this range.

The model appeared to be operationally sound. The mesh independence test showed that the mesh of 6123 cells was sufficient (Paper IV, Figure B1). The solutions did not appear to show nonphysical results. It was able to progress at speeds well above real time, with the most computationally demanding time period (highest average inlet velocity) progressing at approximately six simulation seconds per clock second.
Quality and temperature
The relationship between temperature and quality of sugar beet roots is very important in the long-term post-harvest storage of sugar beet roots. Its importance was an underlying assumption of the CFD modelling (Paper IV), it was the rationale for the innovation project focused on force in-field ventilation that this research project was developed alongside (Ekelöf & English, 2022), and it was given a lot of attention in the literature review conducted as part of this research project (English, 2020). There is, however, very little new insight to this relationship as a result of this project. The modified atmosphere experiment (Paper III) did show that higher temperatures lead to more rapid mass flux and thus potentially more rapid changes in quality, and while possibly a novel finding for the sugar beet crop, it is a relationship already codified in Tetens equation as used to estimate water vapour pressure deficit.
One aspect of the relationship of quality to temperature that has repeatedly been considered during this research project is the difference between the temperature of the fluid air and the temperature of the solid roots. It is an important distinction but it is often difficult to explicitly know which temperature is being discussed in the available literature. The majority of research has focused on the temperature of air, usually ambient air (eg Jaggard et al., 1997; Legrand & Wauters, 2012), presumably primarily because this is much more simple to assess. It is also likely that it is sufficiently accurate. Some applications in the assessment of clamp temperature only require a single temperature input. This includes the estimation of the heat of respiration. The small but consistent difference between the air temperature and the temperature of the root found in the CFD modelling (Paper IV, Figure S5.1) suggest that while the use of air temperature is likely sufficient, the use of root temperature would be more accurate. Other applications require that both the air and root temperature is known. This includes the modelling of heat transfer between roots and the air over a temperature difference, as done in the CFD modelling (Paper IV), or the application of Tetens equation when thermal equilibrium between the air and the root is not assumed. The next level of complexity is then to remove the assumption of thermal equilibrium within the root, as applied in Paper IV. It is likely here that the same team of researchers that made it possible to include convection in the CFD modelling of clamp temperature – Tabil, Kienholz, et al. (2003) – will hold the key. Their 20 year old research on sugar beet thermal properties – Tabil, Eliason, et al. (2003) – plus the rates of cooling reported in the NBR supervised student project Skyggeson (2016), will be invaluable.
Areas for improvement for the temperature model
The solution from the model lags the experimental results (Paper IV, Figures 5 and C3). This is particularly so at the edges of the clamp region. Steps to improve the accuracy of the model could initially include testing changes to the porosity in the edge zone, in line with this zone being the interface with the open region. Any improvement of the model at the edges will likely have flow-on consequences to the rest of the solution, likely reducing the lag the model experiences. It would also be important for the application of the model in Sweden, where loss of material in clamps from frost occurs first at the edges. These modifications should be tested with new, high quality field data for temperature and airflow. The model has been developed without validation of the airflow fields. The collection and analysis of field data on airflow rates within the clamp is required to iterate the model with confidence.
This model was always meant to be a foundation for further development, in the knowledge that important components of the system were absent from this first version. The main shortcomings noted in Paper IV include the exclusion of the thermal properties of soil, of natural convection, and of radiation. The ‘chimney’ effect of heat escaping out the top of a clamp is often raised in discussions about the use of plastic covers on clamps (Olsson, 2013b). This phenomena does not seem to occur when a non-permeable cover is included in the model. This specification was tested subsequent to the submission of Paper IV. The inclusion of buoyancy in the model, for example through the Boussinesq approximation, would likely see this phenomena occur (Carta, 2021a). In another test subsequent to the submission of Paper IV, the model has been tested against a long period of freezing temperatures in December 2022. This period was accompanied by very low or zero air speeds. When this weather data was applied to the model, it showed that the inlet air temperatures were not able to flow into the model domain as they likely should. No such scenarios with long periods of zero airflow were tested in Paper IV, so this issue was not highlighted then. As noted in Section 4.2.1, to further improve the accuracy of heat transfer within the CFD model, it may be necessary to include mass transfer of water in the system.