SUGAR BEET SURFACE AREA
This post discusses the estimation of the surface area of sugar beet. For now, this is largely guess work – no empirical data to confirm the modelling results has yet been sourced. It seems likely that some experiment data exists (Stefan Paulus at Ifz, I’m looking at you), but it hasn’t been asked for yet.
WHY SURFACE AREA?
When we look at the rates of damage in beets, we generally score the area of the surface for which the cellular structure has been disturbed. It is these points of damage that the beet will expend extra energy to heal, through which pathogens can more easily penetrate the beet, and from which water and sugar are more easily leaked. If comparing beets of different size, it seems useful to have a relative number – the area of damage per unit of surface area. For example, a large beet with 100cm2 of damage has an equivalent 15% of the total surface area damaged, while a small beet with 90cm2 of damage has an equivalent 25% of the total surface area damaged. The large beet will also have a smaller volume to surface area ratio, and thus for each tonne of beet, the large beet should thus have a lot less damage to the surface area, and thus less loss per tonne.
“Seems” as the idea hasn’t actually been tested yet.
A further place the measurement of surface area is very useful is in determining the specific surface area for use in the ongoing CFD modelling done at NBR/ SLU/ biophd. Specific surface area is the ratio of surface area to volume. In the modelling, this factor is used in determining how much heat energy will move between the sugar beet in a clamp to the air moving through the clamp.
A FIRST MODEL
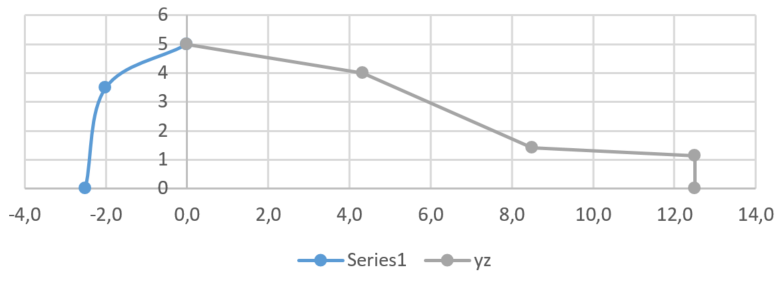
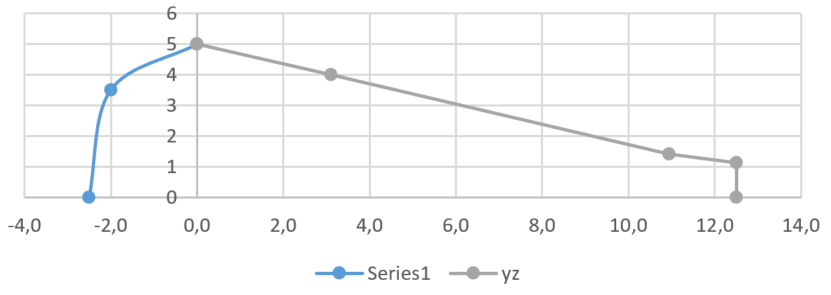
There have been numerous draft ideas and sketches of how a model of sugar beet surface area would work. The first solvable solution that has been developed was a result of the clear thinking of the Statisticians in the Department of Biosystems and Technology, SLU. The suggestion was to split the domain into three zones, with linear approximations of the boundary, solving for the beet total volume. Total volume was just taken as the measured beet weight / density (set at 1.10 g/cm3), The volume of each of the three linear section is that of a truncated cone. A semi-ellipsoid was used to model the top of the beet. Data was also known for the width of the beet at the widest point (x=0 on the graphs), and the width at and distance to the point of breakage at the tip. The values of the first and second points along the beet edge after x=0 (so, at ca. 4.2 and 8.2 in the image on the left below) was taken as width at widest diameter x 0.80 and width at tip breakage / 0.80, respectively. The relative size of the zones along x was then given as r and is the variable to solve on. Two versions of the model are seen below, with the r values given.
Continual refinement and additional data through the model are needed, but from the data taken from approximately 350 individual sugar beets from 10 different fields in 2021, the specific surface area is calculated as 30.04 m2/m3. Bulk density is taken as 0.7 = 700kg/m3. At 1.509 kg per beet, that’s 463.8 beets/m3. With a surface area calculated from the model as 648.0cm2 = 0.06480m2 on that 1.509kg beet, there are 0.06480 x 463.8 square meters of sugar beet area per cubic meter filled with sugar beet.
Again, verification of the model is needed before this result can be completely trusted, but the numbers feel OK.
SOME FIRST RESULTS
Beyond the numbers given above, some other interesting results have come out of the first application of this model. When the beets were grouped into size, as either randomly selected (R), or deliberately sampled into small (S), or large (L):
| Surface Area (cm2) | Weight (g) | Surface Area/ Weight | |
| Small | 371 | 641 | 0.58 |
| Random | 632 | 1390 | 0.45 |
| Large | 958 | 2650 | 0.36 |
If it is correct that these beets have the same bulk density, then larger beets should lose less heat and moisture per unit volume = per unit weight.
When the level of damage to the surface was compared within these same size groupings, the sample got a bit smaller, but differences can still be seen. The results, however, point in the opposite direction – that small beets might lose less sugar per unit volume = per unit weight. This is a result of less damage per unit area.
| Damage to surface | |
| Small | 1.4% |
| Random | 3.0% |
| Large | 3.6% |
These surface area damage results don’t include the root tip breakage point, or the topping. That might bring things back to more even results. It also doesn’t consider that the main issue with surface damage over long-term storage is the rots that grow into the beet. In a small beet, a 1cm deep growth over 1.4% of the area might be a much larger percentage of the beet volume compared to a 1cm deep growth over 3.6% of the area of a larger beet.